Written and published on 25 October 2018
- ISES SOLAR CYCLE SUNSPOT NUMBER PROGRESSION FOR SOLAR CYCLE 24 AND HALF OF SOLAR CYCLE 23 (YEARS 2000-2018)
- ISES SOLAR CYCLE Ap PROGRESSION, YEARS 2000-2018
- The Planetary A-Index versus the Planetary K-Index
- 400 YEARS OF SUNSPOT OBSERVATIONS
- Will Solar Cycle 25 Continue the ‘Milding’ Trend?
- SOLAR MAXIMA AND SOCIAL UNREST IN EUROPE, YEARS 1750-2000
- What Is the Likelihood That Social Unrest Will Occur at Times Other than those of Solar Cycle Maxima?
- Prediction of Likely Time Frame of Social Unrest in a Global Context, During Upcoming Solar Cycle 25
- MORE INFORMATION
- Annual Space Weather Graphs for 1976-2016
Dear Ones,
As the current Solar Cycle 24 sputters to a halt, I am wondering what is in store for Earth, with regard to Sunspot frequency and also with regard to social unrest, during the upcoming Solar Cycle 25. Consequently, I have done some investigation about research on Solar Cycle statistics and historical annual statistics numbers of sunspots, and on congruence between solar cycle maxima and violent events such as Revolutions, in the European arena …
ISES SOLAR CYCLE SUNSPOT NUMBER PROGRESSION FOR SOLAR CYCLE 24 AND HALF OF SOLAR CYCLE 23 (YEARS 2000-2018)
SWPC/NOAA has come out with a great space weather graph of Solar Cycle 24 (which is just now ending), and half of Solar Cycle 23, which preceded it.
As can be seen, we are now ‘dragging bottom’ at the end of Solar Cycle 24 …

Image: “ISES Solar Cycle Sunspot Number Progression, January 2000-September 2018,” by NOAA/SWPC Boulder, CO … public domain
Image: “ISES Solar Cycle Sunspot Number Progression, January 2000-September 2018,” by NOAA/SWPC Boulder, CO … public domain
ISES SOLAR CYCLE Ap PROGRESSION, YEARS 2000-2018
The below chart shows the Planetary Ap Index for most of the current Solar Cycle 24, which began in December 2008 and is thought to have ended in mid-2018, and the prior Solar Cycle 23, which lasted from August 1996 to December 2008.
I note the much greater amplitude of the Planetary A-Index swings during Solar Cycle 23, and especially the standout upswing in 2003.
I note as well the Planetary Index maximum for Solar Cycle 23 was in the mid-20s … and for Solar Cycle 24, the current cycle, was in the mid-10s. I expect this indicates a much less heated Thermosphere (1) for Earth for the currently ending Solar Cycle …

Image: “ISES Solar Cycle Ap Progression,” Data from January 2000 through September 2018, by NOAA/SWPC Boulder, CO … public domain
Image: “ISES Solar Cycle Ap Progression,” Data from January 2000 through September 2018, by NOAA/SWPC Boulder, CO … public domain
The Planetary A-Index versus the Planetary K-Index
I wondered why the graph shows the Planetary A-index, rather than the accustomed Planetary K-index. I found out that the Planetary A-index “provides a daily average level for geomagnetic activity. Because of the non-linear relationship of the K-scale to magnetometer fluctuations, it is not meaningful to take the average of a set of K-indices. What is done instead is to convert each K back into a linear scale called the ‘equivalent three hourly range’ a-index … –from Link: “K-index,” by Wikipedia … https://en.wikipedia.org/wiki/K-index … CC BY-SA 3.0 ..
400 YEARS OF SUNSPOT OBSERVATIONS
Here is a graph with as much data as can be ‘fudged up’ for 400 years of sunspot activity. Note that we are currently in what has been termed the ‘Modern Maximum’, which appears to be quieting down …

Image: “400 year sunspot history, including the Maunder Minimum .” This figure was prepared by Robert A. Rohde and is part of the Global Warming Art project. 23 November 2015 … CC BY-SA 3.0
Image: “400 year sunspot history, including the Maunder Minimum .” This figure was prepared by Robert A. Rohde and is part of the Global Warming Art project. 23 November 2015 … from Wikimedia Commons … CC BY-SA 3.0
Here is the description of the graph, from Wikimedia Commons …
“This figure summarizes sunspot number observations. Since c. 1749, continuous monthly averages of sunspot activity have been available and are shown here as reported by the Solar Influences Data Analysis Center, World Data Center for the Sunspot Index, at the Royal Observatory of Belgium. These figures are based on an average of measurements from many different observatories around the world. Prior to 1749, sporadic observations of sunspots are available. These were compiled and placed on consistent monthly framework by Hoyt & Schatten (1998a, 1998b).
“The most prominent feature of this graph is the c. 11 year solar magnetic cycle which is associated with the natural waxing and waning of solar activity.
“On longer time scales, the sun has shown considerable variability, including the long Maunder Minimum when almost no sunspots were observed, the less severe Dalton Minimum, and increased sunspot activity during the last fifty years, known as the Modern Maximum. The causes for these variations are not well understood, but because sunspots and associated faculae affect the brightness of the sun, solar luminosity is lower during periods of low sunspot activity. It is widely believed that the low solar activity during the Maunder Minimum may be among the principal causes of the chilly Little Ice Age, circa 1350-1850 A.D.” –from Link: Wikimedia Commons … https://commons.wikimedia.org/wiki/File:Sunspot_Numbers.png .. CC-BY-SA 3.0
Will Solar Cycle 25 Continue the ‘Milding’ Trend?
Although, very clearly, past solar cycle sunspot performance offers, really, no clue as to sunspot activity in the upcoming Solar Cycle 25, it is possible that the upcoming solar cycle will be a continuation of the ‘milding’ trend currently in place …
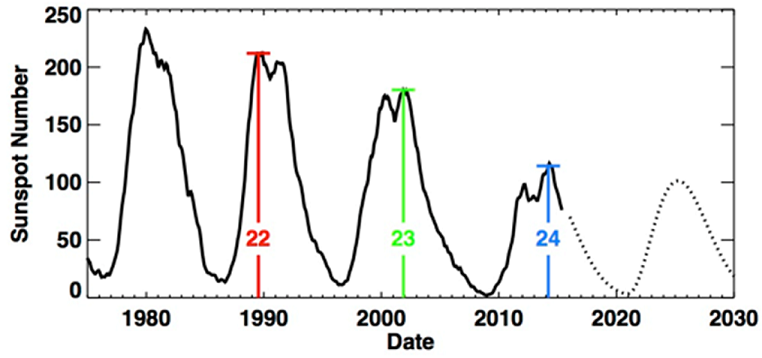
Here is a graph predicting Solar Cycle 25 activity, based on historical performance. Being an ‘old salt’ with regard to stock performance prediction based on historical performance, and seeing a kind of congruence of that with solar activity, I would take the below sunspot prediction with a grain of salt …
Link: “Solar Cycle 25 Prediction: We find that the polar fields indicate that Cycle 25 will be similar in size to (or slightly smaller than) the current small cycle, Cycle 24” … http://solarcyclescience.com/Predictions/Cycle25_Prediction.png ..
The above graph is from …
Link: “Discover the Predictions,” by Solar Cycle Science … http://solarcyclescience.com/forecasts.html#Cycle25Prediction ..
SOLAR MAXIMA AND SOCIAL UNREST IN EUROPE, YEARS 1750-2000
Here is research on solar maxima and violent occurrences such as revolutions in Europe. The conclusion of the author is that there is a relationship …
Link: “Solar Activity and Human History,” by Adam Michalec … http://www.oa.uj.edu.pl/A.Michalec/history.html ..
I note the table of revolutions and other violent governmental events lists 19 such events during that span of years, at times other than solar maxima ..
And then, the graph of solar maxima indicates 15 of the tabulated events occurred during solar maxima … which I feel to be pretty good correspondence …
What Is the Likelihood That Social Unrest Will Occur at Times Other than those of Solar Cycle Maxima?
Of 19 violent historical events in Europe from years 1750 to 2000, it looks like 15 can be pegged to solar cycle maxima. It seems to me that would imply that the likelihood of such an even occurring at a time other than the solar cycle maximum would be 4/19 x 100 = 21%.
Assuming that the European data might be applicable to global social unrest, then about 1 in 5 incidents of social unrest, globally, might be anticipated to occur at times other than those of solar cycle maxima.
Prediction of Likely Time Frame of Social Unrest in a Global Context, During Upcoming Solar Cycle 25
While, on average, solar cycles last 11 years, the variance is 9 to 14 years, according to Wikipedia …
Link: “Solar Cycle,” in Wikipedia … https://en.wikipedia.org/wiki/Solar_cycle ..
The “Discover the Predictions” graph shows Solar Cycle 24 ending in later 2019, it looks like, while Wikipedia has a projection based of mid-2018 as the end date …
Link: “Solar Cycle 24,” in Wikipedia … https://en.wikipedia.org/wiki/Solar_cycle_24 ..
Intuitively, I will go with the Wikipedia estimate. Very roughly, if Solar Cycle 24 is just now ending, and if Solar Cycle 25 lasts the average 11 years, then it will last from 2019 through 2029.
And the next solar cycle maximum might, very roughly, be predicted as occurring in the years 2023-2026.
If Adam Michalec’s research can be extrapolated to a global context, then the likelihood that social unrest will occur, globally, during upcoming Solar Cycle 25 is …
- approximately 80 percent likely during the years 2023-2026 (if they correspond to the upcoming solar cycle maximum), and …
- approximately 20 percent likely during years 2019-2022 and 2027-2029.
In love, light and joy,
I Am of the Stars
……………………………………………..
MORE INFORMATION
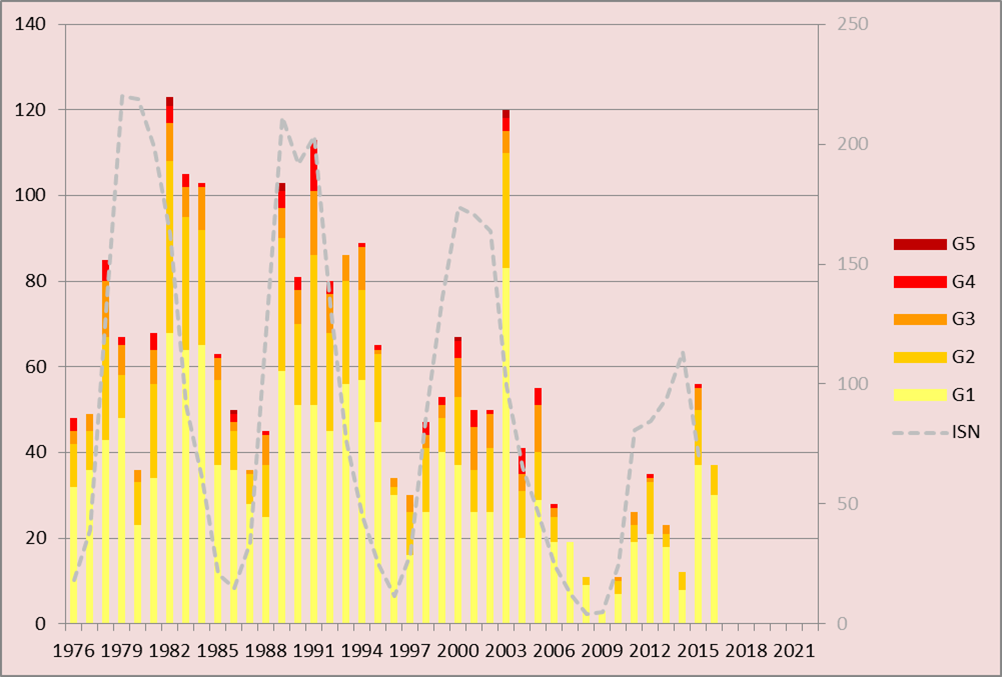
Annual Space Weather Graphs for 1976-2016
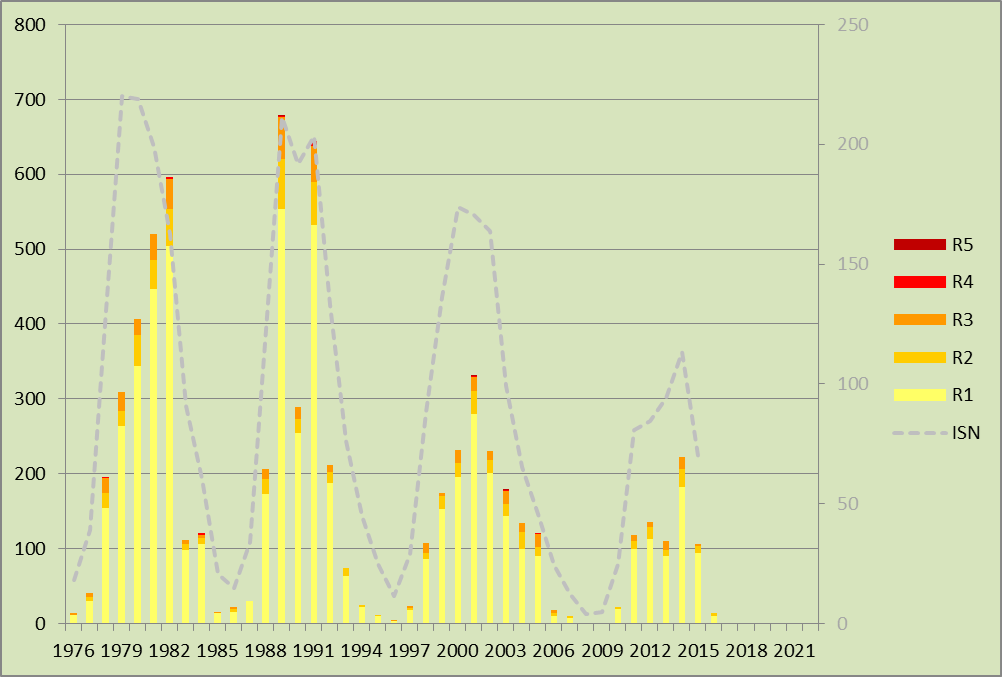
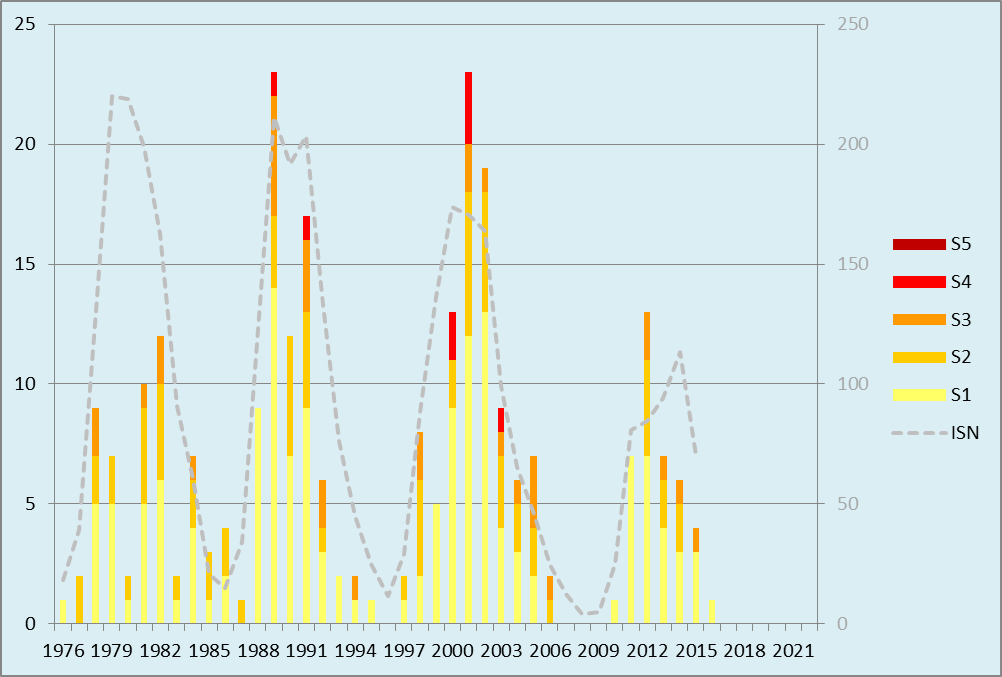
Here are a very good set of graph by the Solar Terrestrial Centre for Excellence … http://www.stce.be/news/366/welcome.html … showing annual data on Space Weather for 1976-2016.
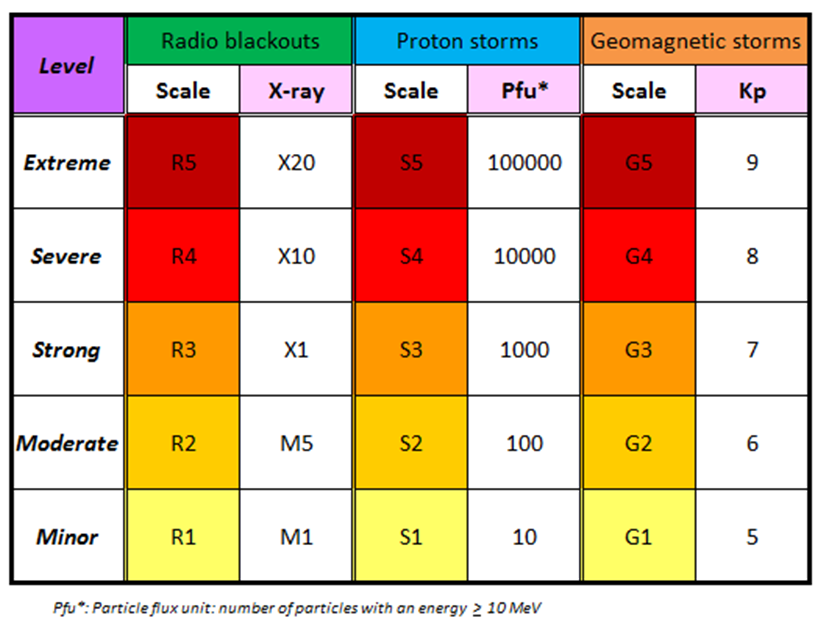
The graphs use NOAA/SWPC coloring, with yellow indicating minor space weather conditions, and on up to dark red indicating extreme space weather conditions …
Image: NOAA Space Weather Scales … http://www.stce.be/sites/default/files/field/image/Picture1_33.png …
There are three graphs: One shows Radio Blackouts, the next shows Proton Storms, and the last shows Geomagnetic storms …
Image: Radio Blackouts, Annual Statistics for 1976-2016, by Solar Terrestrial Centre for Excellence … http://www.stce.be/sites/default/files/field/image/Picture2_23.png ..
Image: Proton Storms, Annual Statistics for 1976-2016, by Solar Terrestrial Centre for Excellence … http://www.stce.be/sites/default/files/field/image/Picture3_20.png ..
Image: Geomagnetic Storms, Annual Statistics for 1976-2016, by Solar Terrestrial Centre for Excellence … http://www.stce.be/sites/default/files/field/image/Picture4_7.png ..
……………………………………..
FOOTNOTE
(1) For more about the thermosphere, see …
Link: “Earth’s Atmosphere and the Collective Mind of Mankind and Other Earth Beings,” by Alice B. Clagett, published on 28 September 2018 … https://wp.me/p2Rkym-afK ..
…………………..

Except where otherwise noted, this work is licensed under a Creative Commons Attribution-ShareAlike 4.0 International License.
…………………………………………………….
…………………………………………………….
space weather, solar cycle, Solar Cycle 23, Solar Cycle 24, Solar Cycle 25, Solar Terrestrial Centre for Excellence, thermosphere, Planetary A-index, Planetary K-index, sunspot activity, solar events, space weather prediction, NOAA space weather scales, radio blackouts, proton storms, geostorms, geomagnetic storms, social unrest, revolution, government,
 RSS - Posts